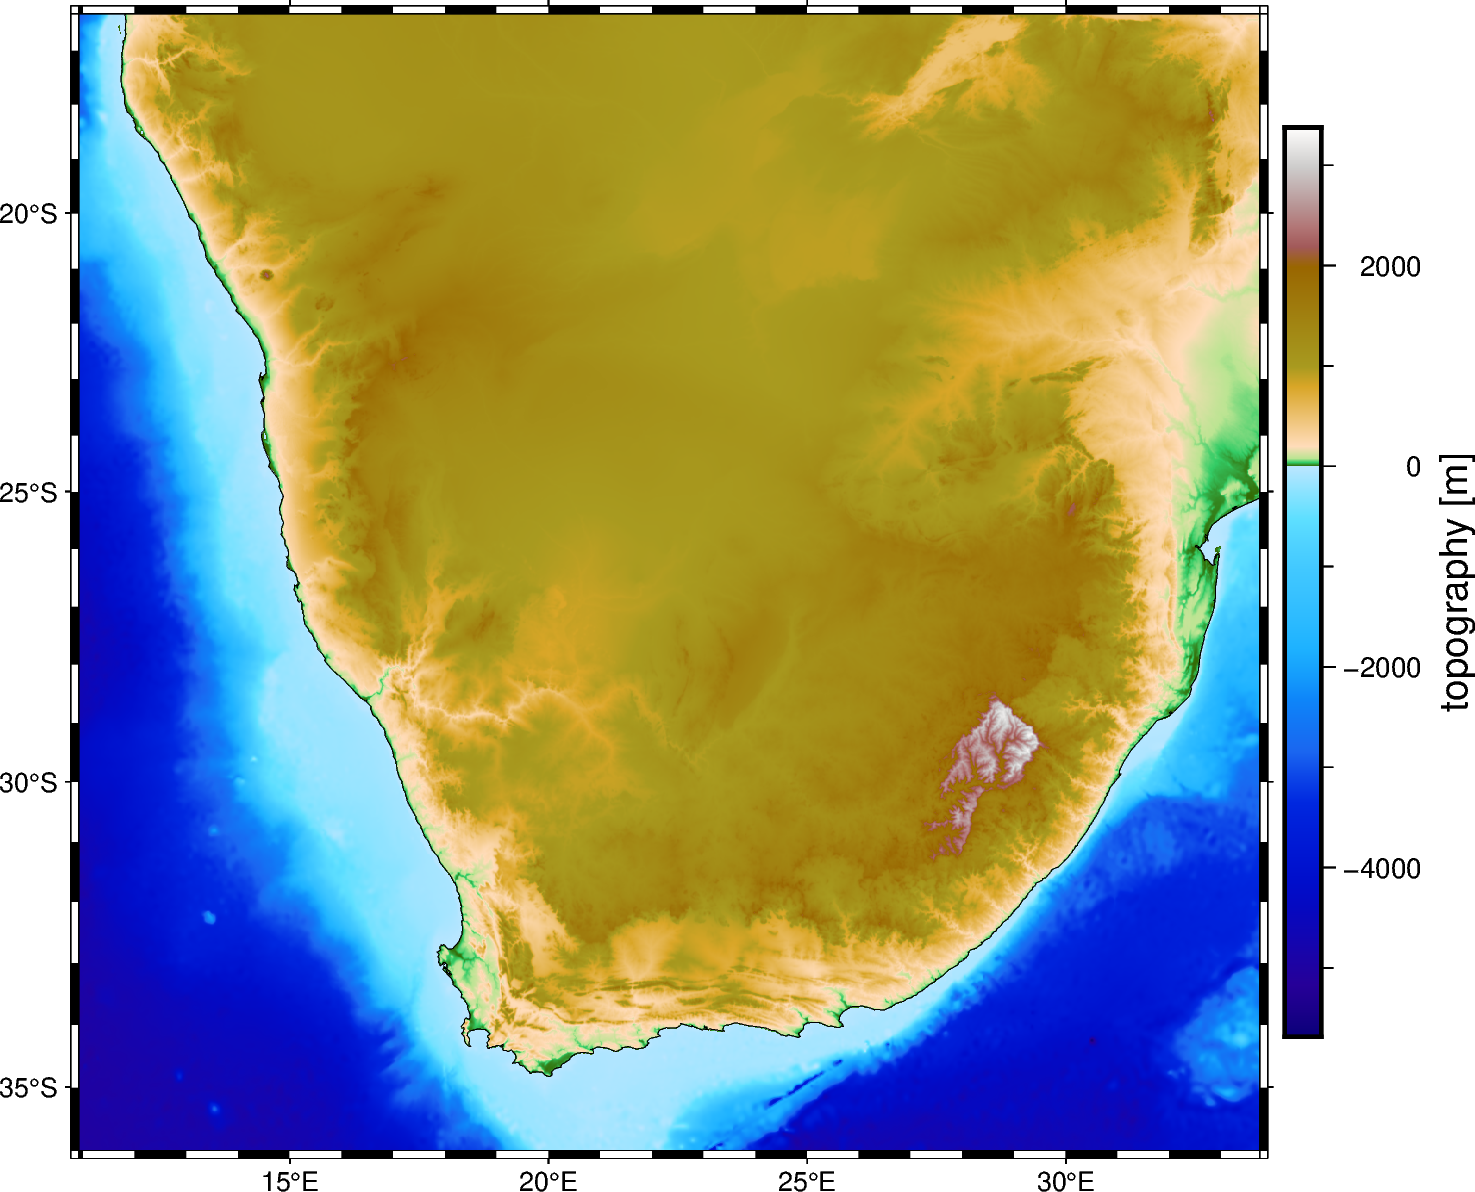
<xarray.DataArray 'topography' (latitude: 1182, longitude: 1371)>
array([[-5039., -5027., -5014., ..., -3846., -3867., -3873.],
       [-5036., -5021., -5007., ..., -3839., -3863., -3872.],
       [-5031., -5016., -5001., ..., -3835., -3860., -3870.],
       ...,
       [-2906., -2901., -2884., ...,   173.,   134.,   118.],
       [-2908., -2906., -2888., ...,   132.,   119.,   118.],
       [-2912., -2910., -2894., ...,   122.,   120.,   128.]],
      dtype=float32)
Coordinates:
  * longitude  (longitude) float64 10.92 10.93 10.95 10.97 ... 33.72 33.73 33.75
  * latitude   (latitude) float64 -36.0 -35.98 -35.97 ... -16.35 -16.33 -16.32
Attributes:
    Conventions:    CF-1.8
    title:          Topographic and bathymetric height for Southern Africa ob...
    crs:            WGS84
    source:         Downloaded from NOAA website (https://ngdc.noaa.gov/mgg/g...
    license:        public domain
    references:     https://doi.org/10.7289/V5C8276M
    long_name:      topographic height above mean sea level
    standard_name:  height_above_mean_sea_level
    description:    height topography/bathymetry referenced to mean sea level
    units:          m
    actual_range:   [-5685.  3376.]
noaa_metadata: Conventions: COARDS/CF-1.0\ntitle: ETOPO1_Ice_g_gmt4.grd\... -5.039e+03 -5.027e+03 -5.014e+03 -5.006e+03 ... 122.0 120.0 128.0
array([[-5039., -5027., -5014., ..., -3846., -3867., -3873.],
       [-5036., -5021., -5007., ..., -3839., -3863., -3872.],
       [-5031., -5016., -5001., ..., -3835., -3860., -3870.],
       ...,
       [-2906., -2901., -2884., ...,   173.,   134.,   118.],
       [-2908., -2906., -2888., ...,   132.,   119.,   118.],
       [-2912., -2910., -2894., ...,   122.,   120.,   128.]],
      dtype=float32)
Coordinates: (2)
Indexes: (2)
PandasIndex
PandasIndex(Float64Index([10.916666666666664,  10.93333333333333, 10.949999999999998,
              10.966666666666663,  10.98333333333333, 10.999999999999998,
              11.016666666666664, 11.033333333333331, 11.049999999999997,
              11.066666666666665,
              ...
              33.599999999999994,  33.61666666666667,  33.63333333333333,
                           33.65, 33.666666666666664,  33.68333333333333,
              33.699999999999996,  33.71666666666666,  33.73333333333333,
                           33.75],
dtype='float64', name='longitude', length=1371)) PandasIndex
PandasIndex(Float64Index([ -35.99999999999997, -35.983333333333306,  -35.96666666666664,
              -35.949999999999974,  -35.93333333333331, -35.916666666666636,
               -35.89999999999997, -35.883333333333304,  -35.86666666666664,
               -35.84999999999997,
              ...
               -16.46666666666664,  -16.44999999999997, -16.433333333333305,
               -16.41666666666664, -16.399999999999974, -16.383333333333304,
               -16.36666666666664, -16.349999999999973, -16.333333333333307,
              -16.316666666666638],
             dtype='float64', name='latitude', length=1182))
Attributes: (12)
Conventions : CF-1.8 title : Topographic and bathymetric height for Southern Africa obtained from ETOPO1 (ice surface) crs : WGS84 source : Downloaded from NOAA website (https://ngdc.noaa.gov/mgg/global/global.html) license : public domain references : https://doi.org/10.7289/V5C8276M long_name : topographic height above mean sea level standard_name : height_above_mean_sea_level description : height topography/bathymetry referenced to mean sea level units : m actual_range : [-5685. 3376.] noaa_metadata : Conventions: COARDS/CF-1.0
title: ETOPO1_Ice_g_gmt4.grd
GMT_version: 4.4.0
node_offset: 0 
