Bathymetry single-beam surveys of the Caribbean
Note
Click here to download the full example code
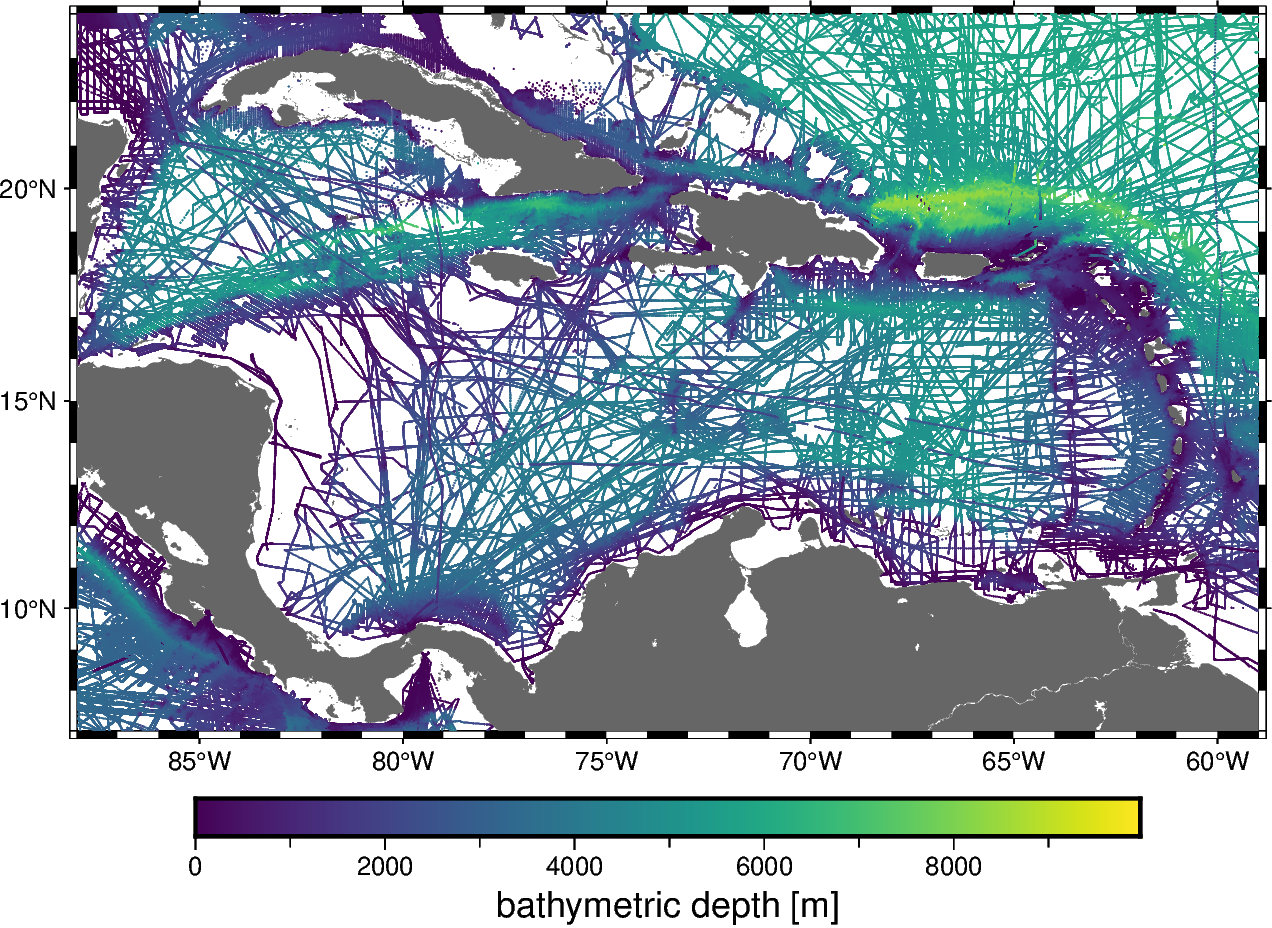
Bathymetry single-beam surveys of the Caribbean
This dataset is a compilation of several public domain single-beam bathymetry surveys of the ocean in the Caribbean. The data display a wide range of tectonic activity, uneven distribution, and even clear systematic errors in some of the survey lines.
Original source: NOAA NCEI
Pre-processing: Source code for preparation of the original dataset for redistribution in Ensaio
import pandas as pd
import pygmt

import ensaio
Download and cache the data and return the path to it on disk
fname = ensaio.fetch_caribbean_bathymetry(version=1)
print(fname)
Out:
/home/runner/work/_temp/cache/ensaio/v1/caribbean-bathymetry.csv.xz
Load the CSV formatted data with pandas
data = pd.read_csv(fname)
data
Make a PyGMT map with the data points colored by the depth.
fig = pygmt.Figure()
fig.basemap(
    region=[
        data.longitude.min(),
        data.longitude.max(),
        data.latitude.min(),
        data.latitude.max(),
    ],
    projection="M15c",
    frame=True,
)
pygmt.makecpt(cmap="viridis", series=[data.depth_m.min(), data.depth_m.max()])
fig.plot(
    x=data.longitude, y=data.latitude, color=data.depth_m, cmap=True, style="c0.02c"
)
fig.colorbar(frame='af+l"bathymetric depth [m]"')
fig.coast(land="#666666")
fig.show()
Out:
<IPython.core.display.Image object>
Total running time of the script: ( 1 minutes 17.277 seconds)