Note
Click here to download the full example code
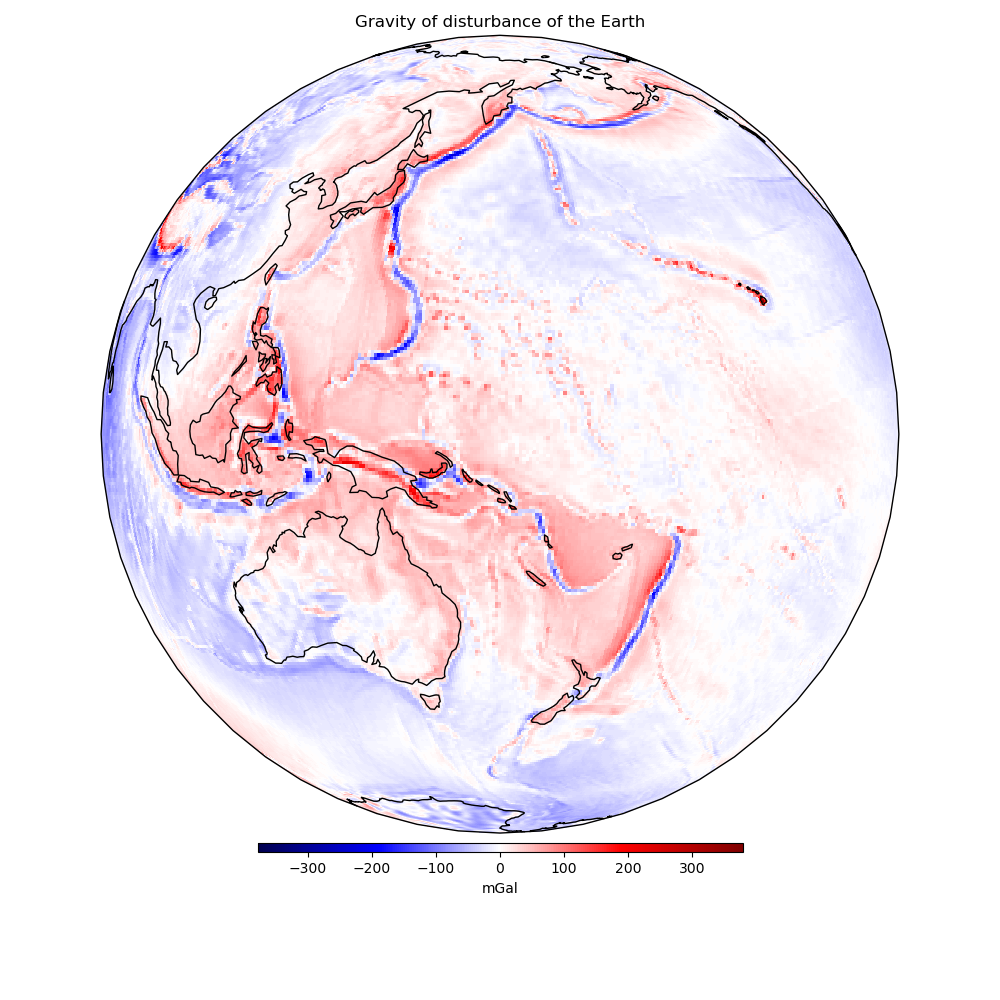
Gravity Disturbances
Gravity disturbances are the differences between the measured gravity and
a reference (normal) gravity produced by an ellipsoid. The disturbances are
what allows geoscientists to infer the internal structure of the Earth. We’ll
use the boule.Ellipsoid.normal_gravity function from boule to
calculate the global gravity disturbance of the Earth using our sample gravity
data.

Out:
/home/travis/miniconda/envs/testing/lib/python3.6/importlib/_bootstrap.py:219: RuntimeWarning: numpy.ufunc size changed, may indicate binary incompatibility. Expected 192 from C header, got 216 from PyObject
  return f(*args, **kwds)
<xarray.Dataset>
Dimensions:          (latitude: 361, longitude: 721)
Coordinates:
  * longitude        (longitude) float64 -180.0 -179.5 -179.0 ... 179.5 180.0
  * latitude         (latitude) float64 -90.0 -89.5 -89.0 ... 89.0 89.5 90.0
Data variables:
    gravity          (latitude, longitude) float64 9.801e+05 ... 9.802e+05
    height_over_ell  (latitude, longitude) float64 1e+04 1e+04 ... 1e+04 1e+04
import matplotlib.pyplot as plt
import cartopy.crs as ccrs
import boule as bl
import harmonica as hm

# Load the global gravity grid
data = hm.datasets.fetch_gravity_earth()
print(data)

# Calculate normal gravity using the WGS84 ellipsoid
ellipsoid = bl.WGS84
gamma = ellipsoid.normal_gravity(data.latitude, data.height_over_ell)
# The disturbance is the observed minus normal gravity (calculated at the
# observation point)
disturbance = data.gravity - gamma

# Make a plot of data using Cartopy
plt.figure(figsize=(10, 10))
ax = plt.axes(projection=ccrs.Orthographic(central_longitude=160))
pc = disturbance.plot.pcolormesh(
    ax=ax, transform=ccrs.PlateCarree(), add_colorbar=False, cmap="seismic"
)
plt.colorbar(
    pc, label="mGal", orientation="horizontal", aspect=50, pad=0.01, shrink=0.5
)
ax.set_title("Gravity of disturbance of the Earth")
ax.coastlines()
plt.tight_layout()
plt.show()
Total running time of the script: ( 0 minutes 0.783 seconds)