Bathymetry single-beam surveys of the Caribbean
Note
Click here to download the full example code
Bathymetry single-beam surveys of the Caribbean
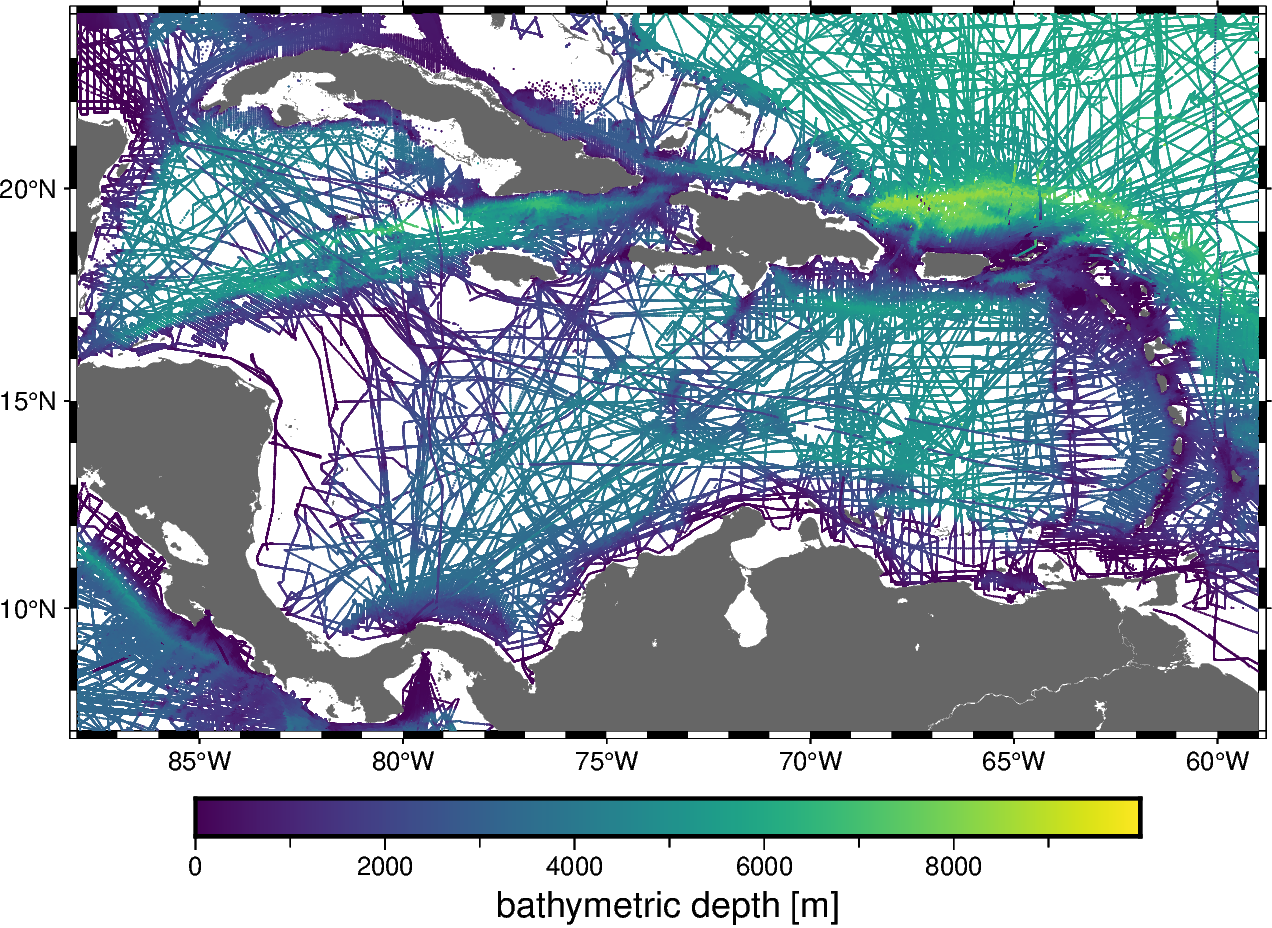
This dataset is a compilation of several public domain single-beam bathymetry surveys of the ocean in the Caribbean. The data display a wide range of tectonic activity, uneven distribution, and even clear systematic errors in some of the survey lines.
Original source: NOAA NCEI
import pandas as pd
import pygmt

import ensaio
Download and cache the data and return the path to it on disk
fname = ensaio.fetch_caribbean_bathymetry(version=1)
print(fname)
Out:
/home/runner/work/_temp/cache/ensaio/v1/caribbean-bathymetry.csv.xz
Load the CSV formatted data with pandas
data = pd.read_csv(fname)
data
Make a PyGMT map with the data points colored by the depth.
fig = pygmt.Figure()
fig.basemap(
    region=[
        data.longitude.min(),
        data.longitude.max(),
        data.latitude.min(),
        data.latitude.max(),
    ],
    projection="M15c",
    frame=True,
)
pygmt.makecpt(cmap="viridis", series=[data.depth_m.min(), data.depth_m.max()])
fig.plot(
    x=data.longitude, y=data.latitude, color=data.depth_m, cmap=True, style="c0.02c"
)
fig.colorbar(frame='af+l"bathymetric depth [m]"')
fig.coast(land="#666666")
fig.show()
Out:
<IPython.core.display.Image object>
Total running time of the script: ( 1 minutes 12.146 seconds)